| |
|
DevInfo dashboards enable complex data sets to be presented in a standard, focused format, thereby making large volumes of data easier to understand, interpret and act on. Online dashboards represent an enhancement to DevInfo databases, harnessing well-designed tables, maps and graphs in an animated, interactive platform. You are invited to explore a selection of dashboards below
|
|
|
Child Well-Being in Rich Countries
This dashboard provides a comprehensive assessment of child well-being in 29 nations of the industralized world. It is a visual representation of the data and key findings included in Report Card 11, produced by the UNICEF Office of Research, and released in April 2013. For more information, please click here.
|
 |
| |
|
|
A Promise Renewed Dashboard
With A Promise Renewed, the nations of the world have renewed a promise to give all children a fair opportunity to survive and thrive. To help monitor progress in keeping this promise, DevInfo has helped UNICEF develop an interactive dashboard with rich maps, tables, and graphs. It answers questions such as: Which countries have reduced child mortality the most? What are the leading causes of child deaths where child mortality rates are high? For more information, please click here.
|
 |
| |
|
CC-MODA Dashboard
Built on DevInfo technology and developed by the UNICEF Office of Research, the CC-MODA (Cross-country Deprivation in Children) Dashboard is a tool that allows users to view and understand the equity focus of child well-being and deprivation analyses around the world. Interactive tables, graphs, and maps are available to compare child deprivation in low- and lower-middle income countries. For more information, please click here. To watch the MODA intro video, please click here.
|
 |
| |
|
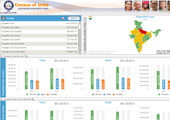
CensusInfo India 2011 Dashboard
Built on CensusInfo technology, the CensusInfo 2011 Dashboard provides a single-view visual report on provisional state-level population data collected in the country’s latest census round. Users can view selected indicators in animated and interactive tables, graphs and maps. Users can also view and save tables and graphs comparing different states and visualize trend data comparing data from different years. For more information, please click here. To watch the CensusInfo India 2011 video, please click here.
|
 |
| |
|
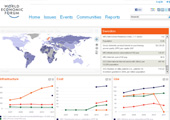
World Economic Forum GITR Dashboard
With an extensive coverage of 138 economies, the World Economic Forum’s Global Information Technology Report (GITR) remains the world’s most comprehensive and authoritative international assessment of the impact of information and communications technology on the development process.
The GITR interactive dashboard provides users with a set of tools to explore the impact of information and data technology on a range of socio-economic areas. A range of visualization tools allows users to explore and gain new insights into the relationships between technology and other domains. For more information please click here.
|
 |
| |
|
CME Info
The CME Info online dashboard displays the latest child mortality estimates based on the research of the Inter-agency Group for Child Mortality Estimation. The dashboard allows users to view child mortality estimates through country maps, generate spline estimate graphs, view underlying data series, view estimate uncertainty ranges, and compare different estimates. For more information, please click here.
|
 |
| |
|
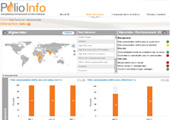
Polio Info dashboard
This dashboard provides live data against the global polio communication indicators with geographic disaggregation. Analysis of this social data is then used to guide the development of communication strategies at national and community levels in all the polio priority countries. For more information, please click here.
|
 |
| |
|
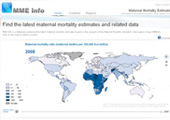
MME Info
MME Info is a comprehensive data visualization portal containing the latest maternal mortality estimates released by the Maternal Mortality Estimation Inter-agency Group as well as related indicators. The site is designed to track global progress on maternal mortality at the country and regional levels, allowing for easy analysis and visualization of the latest and most relevant data. For more information, please click here.
|
 |
| |
|
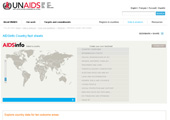
UNAIDS
This data visualization and dissemination dashboard was launched by UNAIDS with the objective of facilitating access to and use of AIDS-related data. AIDSInfo is populated with multi-sectoral HIV data at the global and country levels, including AIDS spending, epidemiological estimates, country-reported programmatic data, and National Composite Policy Index responses from government and civil society. For more information, please click here.
|
 |
| |
|
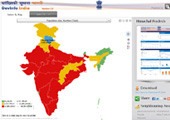
DevInfo India
This dashboard allows users to view downloadable socio-economic profiles for states in India, showcasing the latest data. Users can also select and view a wide range of indicators, generating dynamic displays on the interactive map. For more information, please click here.
|
 |
|
To learn more about implementing a DevInfo dashboard for your organization, please contact support@devinfo.info.
|
|
|
|
|
|
| |
|

